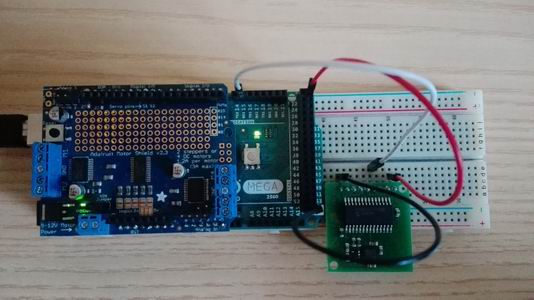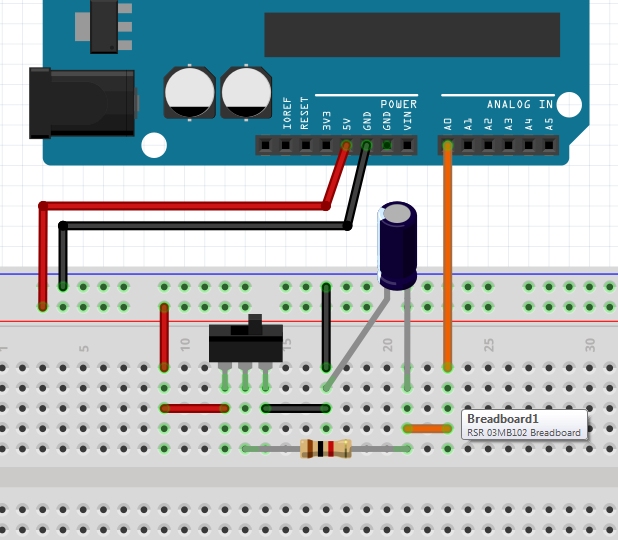
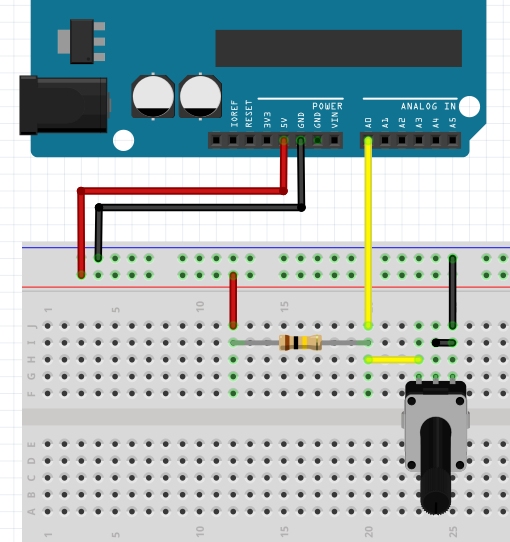
I propose a new measurement experiment using Arduino, working as DAQ (data acquisition instrument). I proceed as described in the articles Arduino and Excel with PLX-DAQ and Voltage divider measurements with PLX-DAQ: I mount my circuit on breadboard powered by the Arduino board at 5V. I propose to analyze the charge and discharge of a capacitor and collect data in a Excel spreadsheet.
In this lab test, I use the following devices: 1 capacitor 3300µF (electrolytic), 1 resistor 1kΩ,1 switch, 5V Arduino supply.
I write the Arduino sketch reported below.
#define sensorPin A0 // select the input pin for the potentiometer
int sensorValue = 0; // variable to store the value coming from the sensor 0-1023
float sensorVoltage = 0; // variable to store the voltage coming from the sensor 0-5V
int cont = 0;
void setup() {
Serial.begin(9600);
Serial.println("CLEARDATA");
Serial.println("LABEL,t,COUNTER,V-CONDENSATORE");
}
void loop() {
// read the value from the sensor
sensorValue = analogRead(sensorPin);
// calculate voltage
sensorVoltage = sensorValue*5.0/1023.0;
// send value to USB
Serial.print("DATA,TIME,");
Serial.print(cont++);
Serial.print(",");
Serial.println(sensorVoltage);
// delay 100ms
delay(100);
}
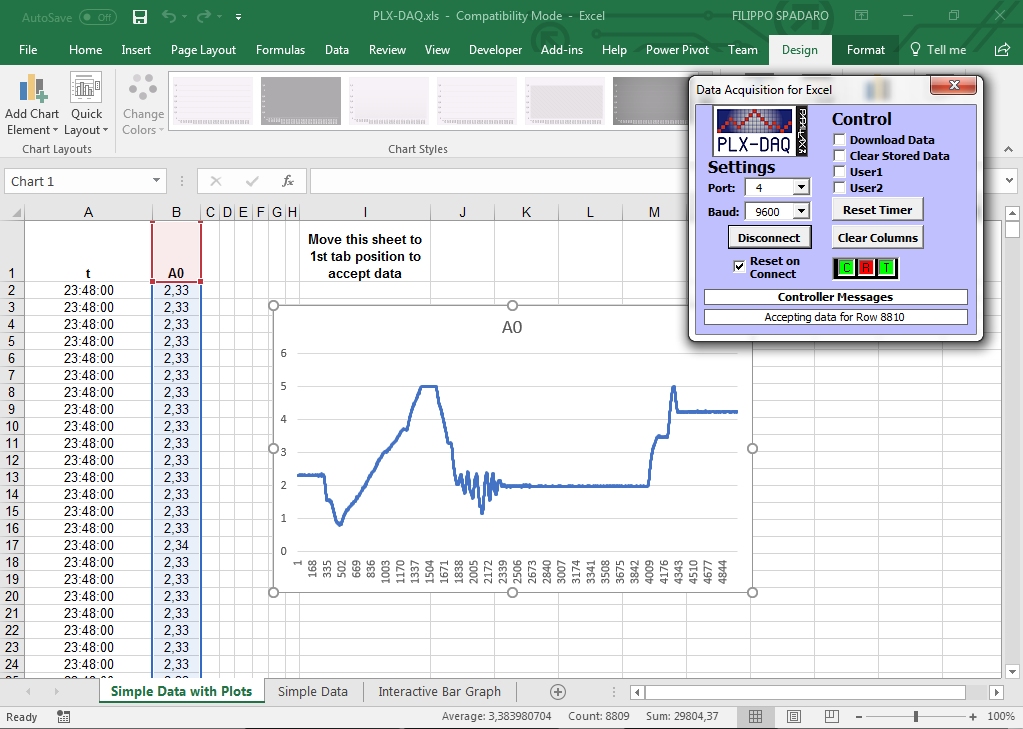
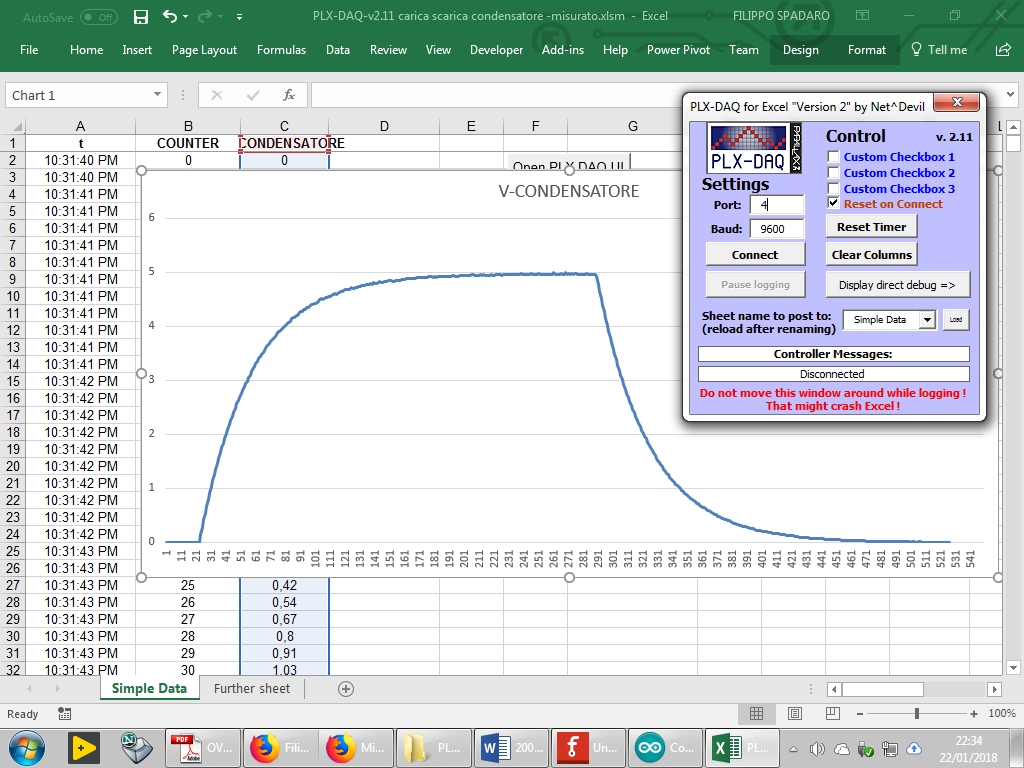
The figure below shows a measurement test with data collection in Excel and a 2-Dline type graph to represent voltage measured on capacitor.
 I propose a new measurement experiment using Arduino, working as DAQ (data acquisition instrument). I proceed as described in the article
 We know that Arduino allows to acquire data in the analog input. We can use Excel to store data in a sheet and display it in a graph using an application available on the network called
 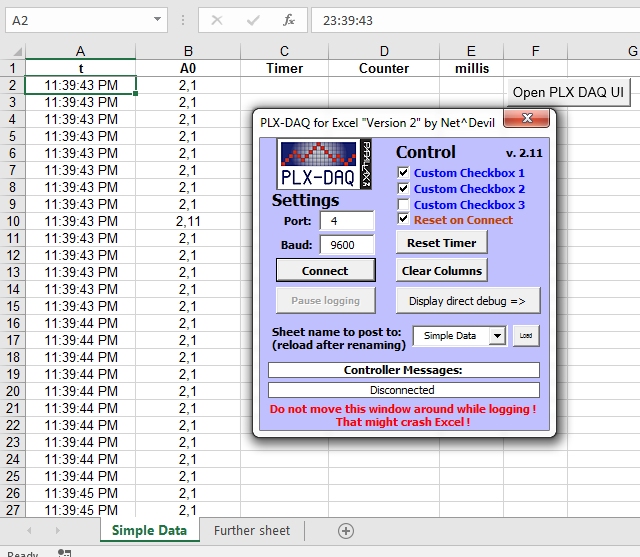 Let's load this sketch in Arduino, which will send data read from the analog port A0 on the USB, associating them with the instant of acquisition time. We have programmed the Serial.print instructions according to the modality proposed by PLX-DAQ (see the reactive help for more details).