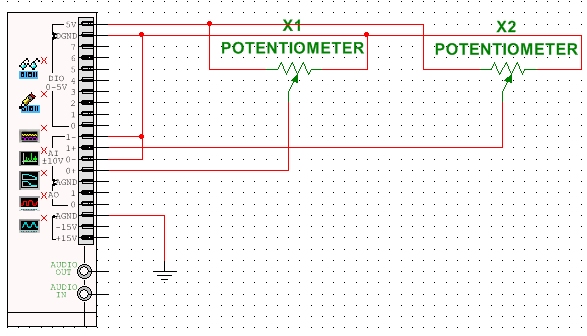
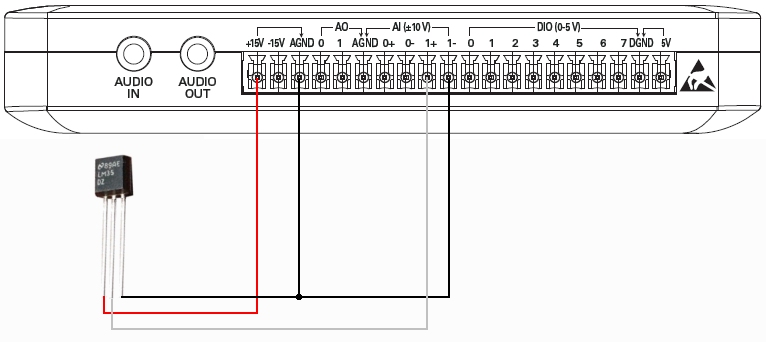
I want to connect two LM35, one in basic mode to measure the temparature in my room at home and one in full-range mode to measure the temparature outside my window.
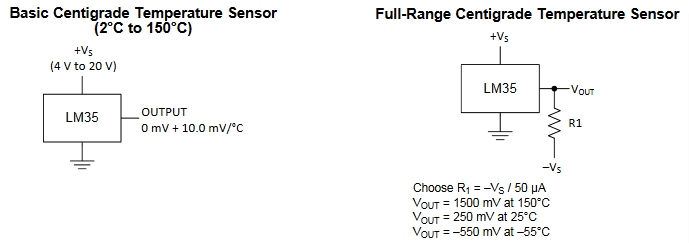
I connect the two transducers to myDAQ using the +15V positive supply for the first LM35 and the negative supply -15V for the second device. These supplies and the relative AGND ground are available at the myQAD terminals. I calculate the resistance R1 = 300kΩ which produces the voltage level translation as indicated in the LM35 datasheet (it would be better to use a trimmer to calibrate the resistance correctly, considering the resistive tolerances, or I can insert a Slide in LabVIEW to perform a measurement correction of temperature).
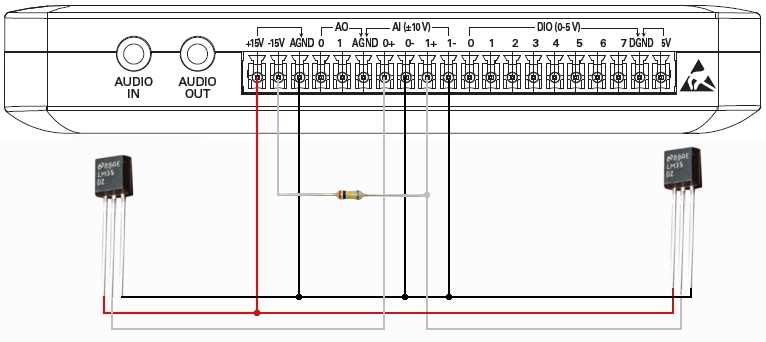
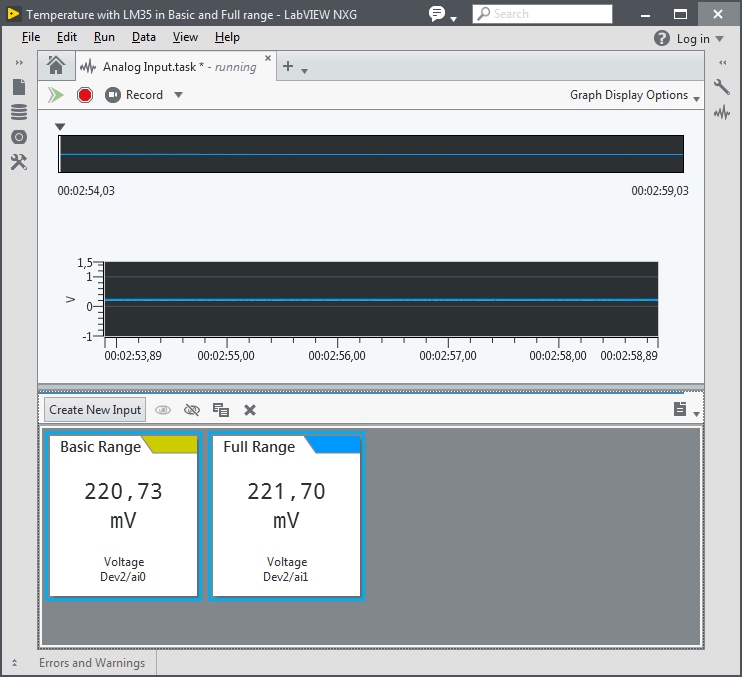
Then I open an Analog Input task in LabVIEW NXG for the transducer connected to AI0 and click on Create New Input to open another Analog Input task to acquire the measurements from the transducer in AI1. I can leave Analog Input as default, between -10V and + 10V, because the acquisition range in full-range mode is -0.5V and + 1.5V.
I create a New VI that acquires the temperature value from the two transducers. Initially I put them close and I adjust their measurements with a reference thermometer. After I put the full-range transducer out of my home window and I leave the other transducer inside the house.
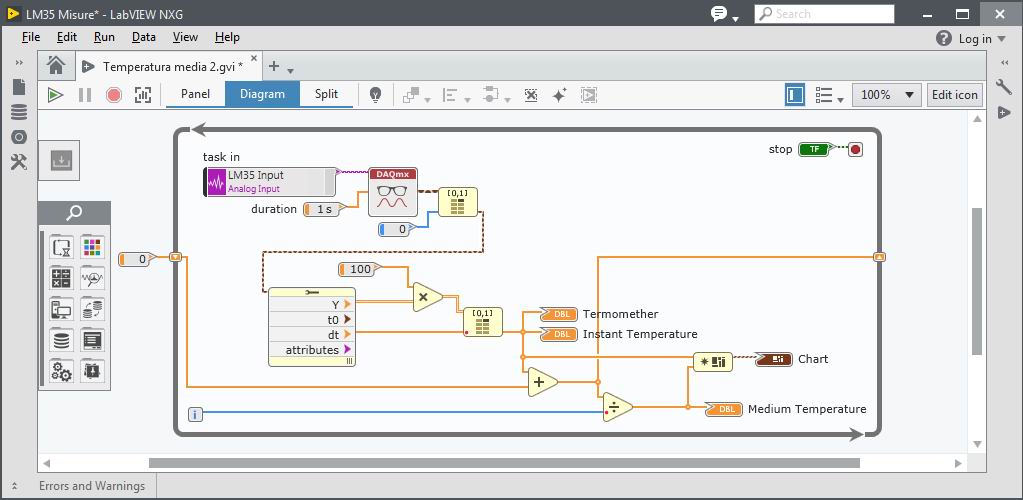
I create a new VI by clicking with left mouse button in white area of Navigation panel and choosing Add new > VI on the cascade menu. So I use my Analog Input that I created, to start writing my program from the beginning. I drag Analog Input into the VI Diagram and incorporate it into a While Loop. The output from DAQmx Read VI is 1D array of Waveform signal. With Index Array VI I just pick two elements of Waveform from the Waveforms array (the last acquired from AI0 channel is in 0 position, and from AI1 is in position 1). After I use Waveform properties VI to index the 1D Waveform array and get the individual elements from a single Waveform cluster. The Waveform data type is a special type of cluster made up of 4 elements:
- Y - This is a 1D Array of the amplitude measurements of your data.
- t0 - This is a time stamp signifying the start time of your measurement.
- dt - This is a scalar that describes the uniform time division of the signal in seconds.
- attributes - This is a variant data type containing all of the waveform metadata, such as the hardware device number or the channel names.
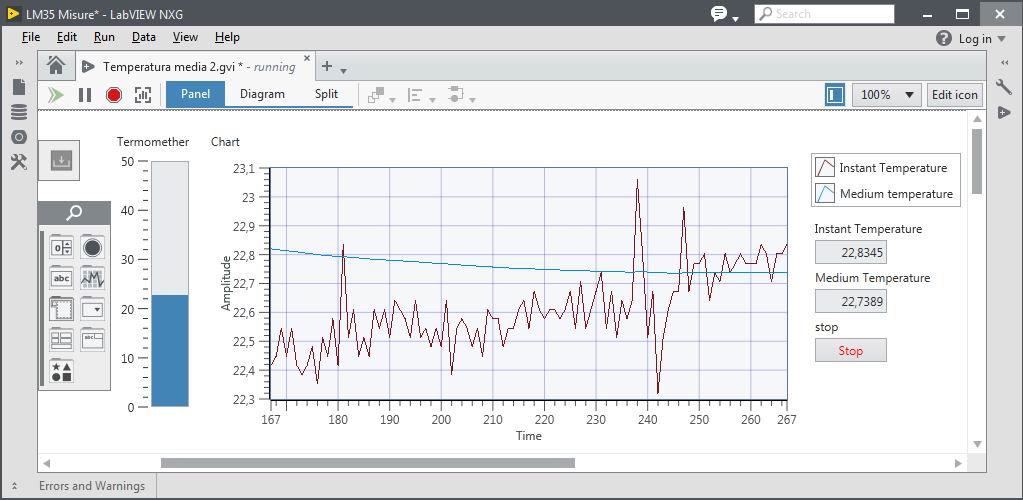
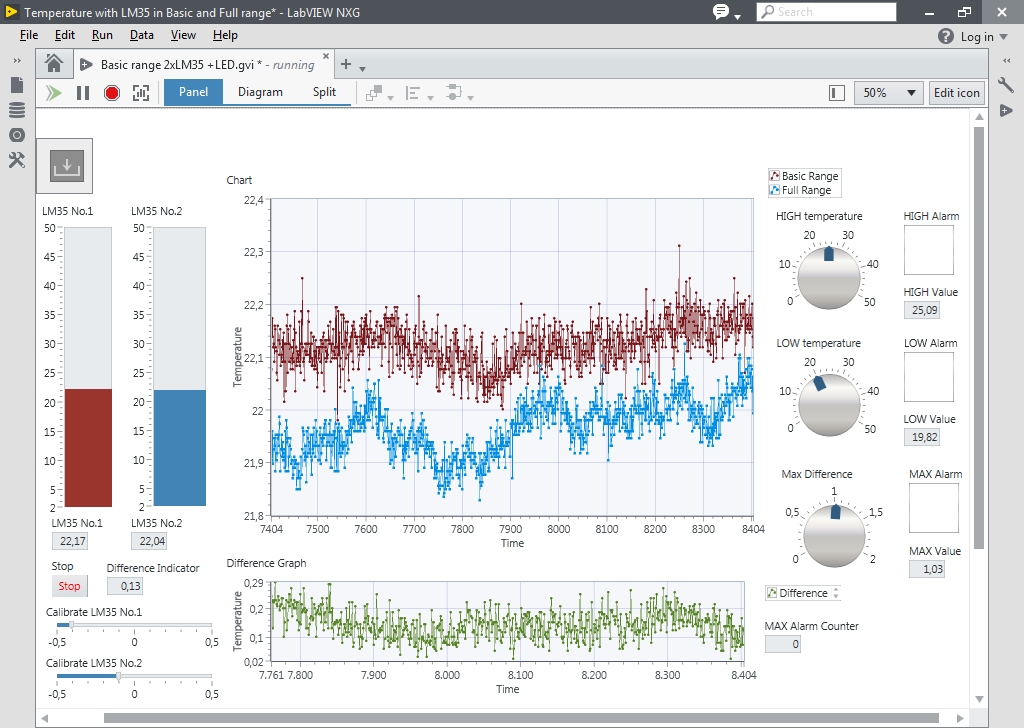
I try some software solutions, as you can see in the front Panel of LabVIEW in the following figure:
- publish the two temperatures with Tanks and Charts;
- provide the user of the Slide to be able to properly calibrate the measurement, considering the resistive tolerances (the fourth band of the resistor is gold = 5%) and those of the LM35 (0.5°C ensured accuracy at 25°C);
- publish the difference between the two temperatures with an Indicator and a Chart.
- publish the average values of each of the two measures with Indicators and Charts.
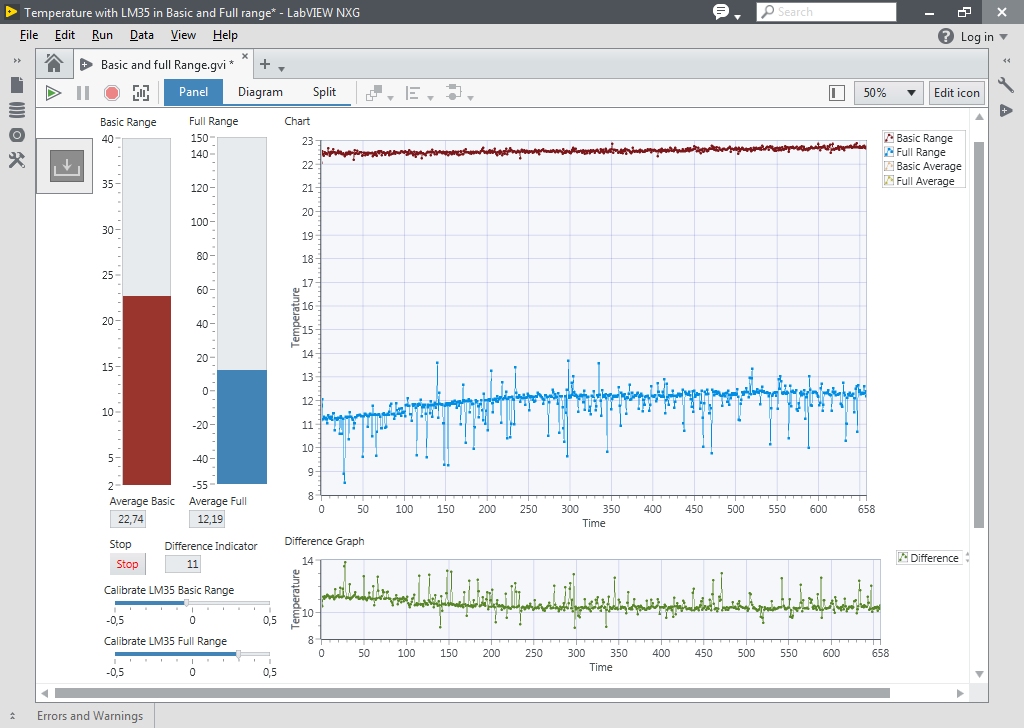
In the previous figure I am running the VI and in the Panel I see the result of the acquisition and processing that I have programmed.
I get the actual voltage value of the Waveform from Y node and I multiply it by 100, so obtain the temperature value in Celsius degrees. I use the scalar dt to index a new array using Index Array VI and thus can represent the temperature on a Tank or on a Chart graph.
I provide the user of the Slide to be able to properly calibrate the measurement of both transducer.
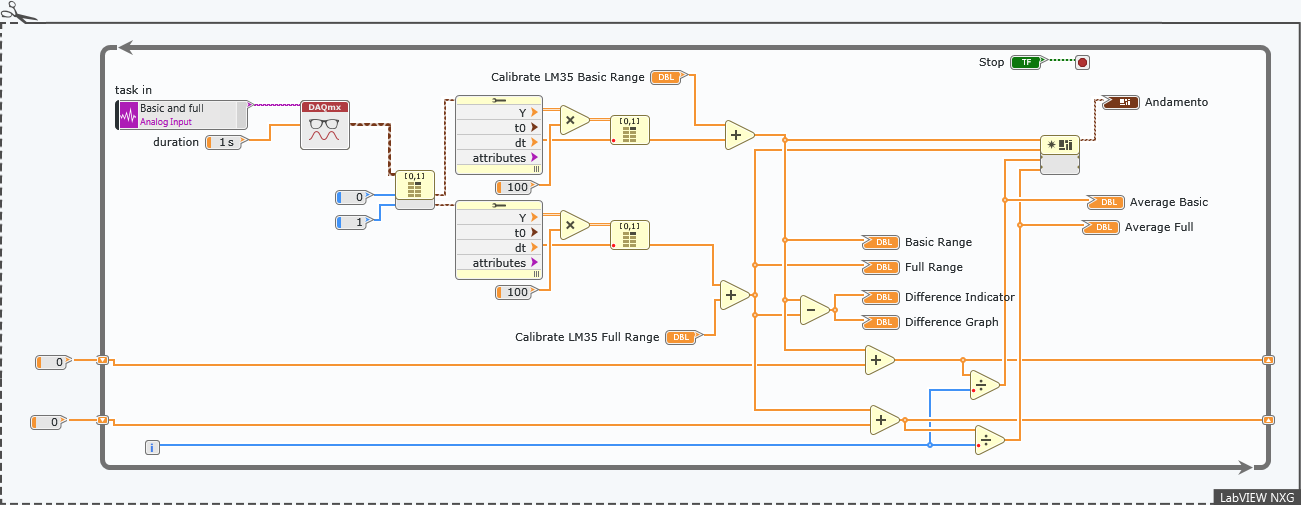
After I program two Shift Registers to print the trend of the average temperature, by clicking with the right mouse button on the edge of the While Loop and setting a Numeric Constant = 0 as the initial condition. The shift register serves me to realize the operation sum = previous sum + current value. Then I divide the partial sums by the number of current iterations i of the While Loop.
To publish on the same Chart the four graphs of instantaneous and average temperature for the two trasducers I have to gather the four values in a single cluster through Buid Cluster and then send them to the graph.
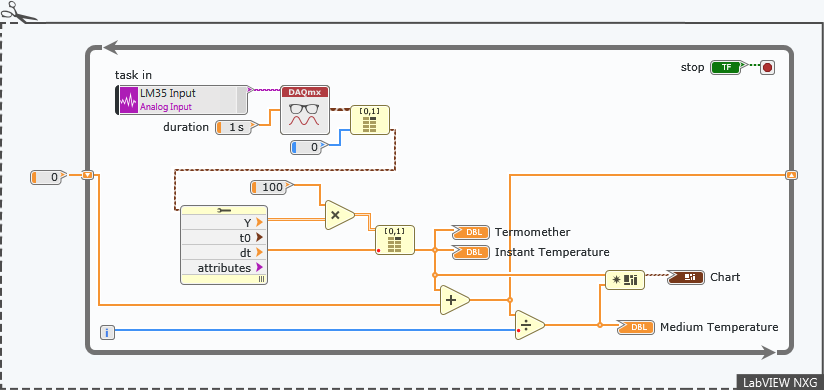
The following figure shows the snippet of the block Diagram, that you can save in PNG format from this web page and open with LabVIEW. It is important to have a myDAQ or a DAQ of any kind to connect to your PC and replace the two Analog Input with new created by you.
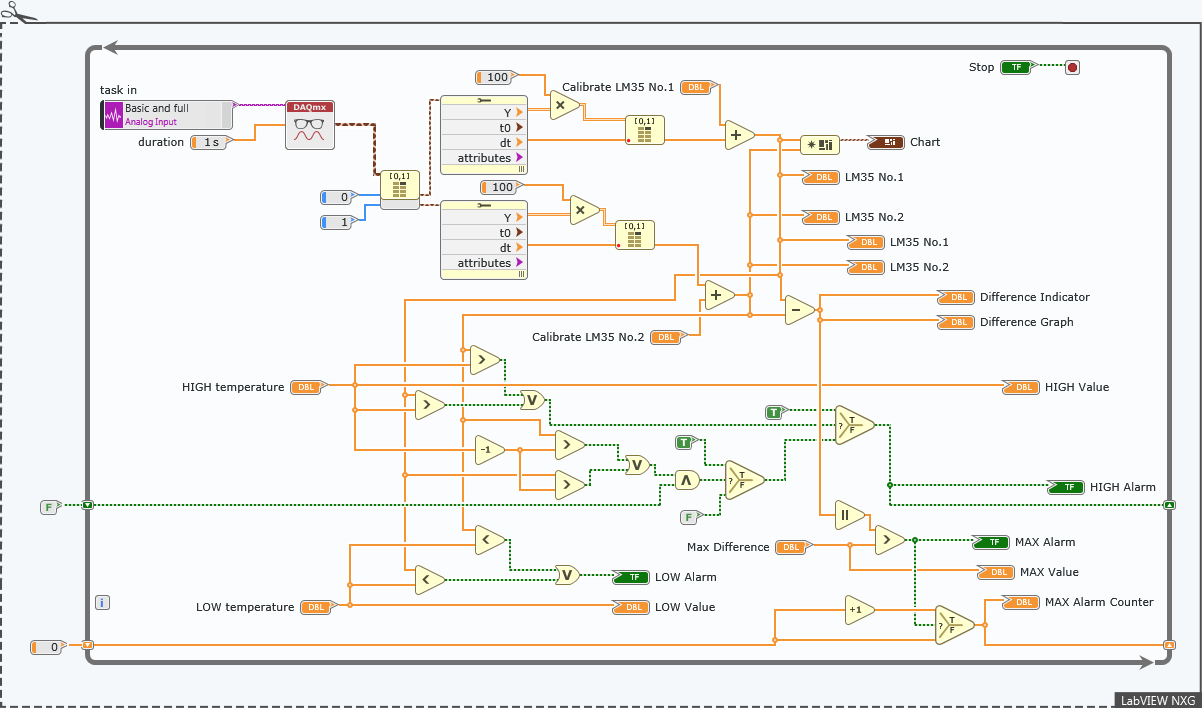
In another example we are able to perform measurements at two points of the same environment (room, silos, tank, etc.) and evaluate:
- if one or both temperatures exceed a maximum value allowed (HIGH Alarm LED) or fall below a minimum value allowed (LOW Alarm LED); the alarm values are set by the user using Knobs;
- if the temperature in the environment remains constant, or the difference between the two temperatures is about zero or within a range setted by a Knob (MAX Alarm LED).
A possible solution is shown in the front Panel below:
To publish on the same Chart the two graphs from the two trasducers I have to gather the two values in a single cluster through Buid Cluster and then send them to the graph.
In the previous figure I am running the VI and in the Panel I see the result of the acquisition and processing that I have programmed. In the next image is reported the relative block Diagram:
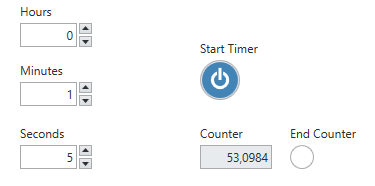 Let's learn how to develop a simple timer in LabVIEW NXG. The image shows the labVIEW Panel with
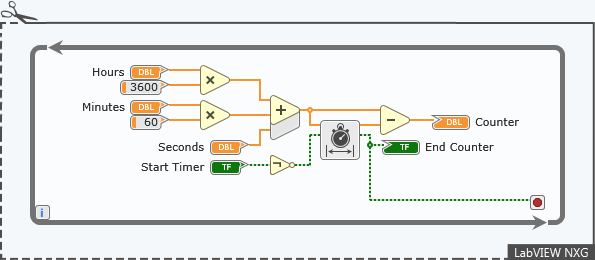
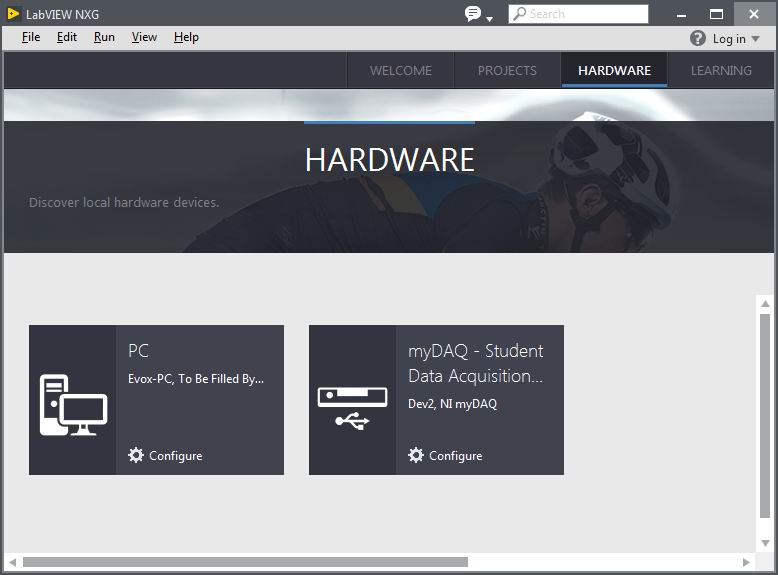 After I connect myDAQ device to my computer, the device is immediately discovered in the Hardware tab of LabVIEW NXG. In the Hardware tab, I can validate hardware connections with access to the pinout, manual, and specifications and perform basic troubleshooting steps.